

Exploring Geospatial Data Types: Raster vs. Vector
An introductory guide to understanding different types of geospatial data and their applications in spatial analysis.

The two fundamental data types we use in Geographic Information Systems (GIS) are raster data and vector data. These data types are the building blocks of countless applications, from digital mapping to environment modeling. Understanding these data types is essential for a secure footing in spatial analysis.
Raster Data
Raster data are fixed grids (sometimes called matrices) made up of cells, each containing some arbitrary value. You can think of them as pixels within a photograph. However, rasters can also be three-dimensional.
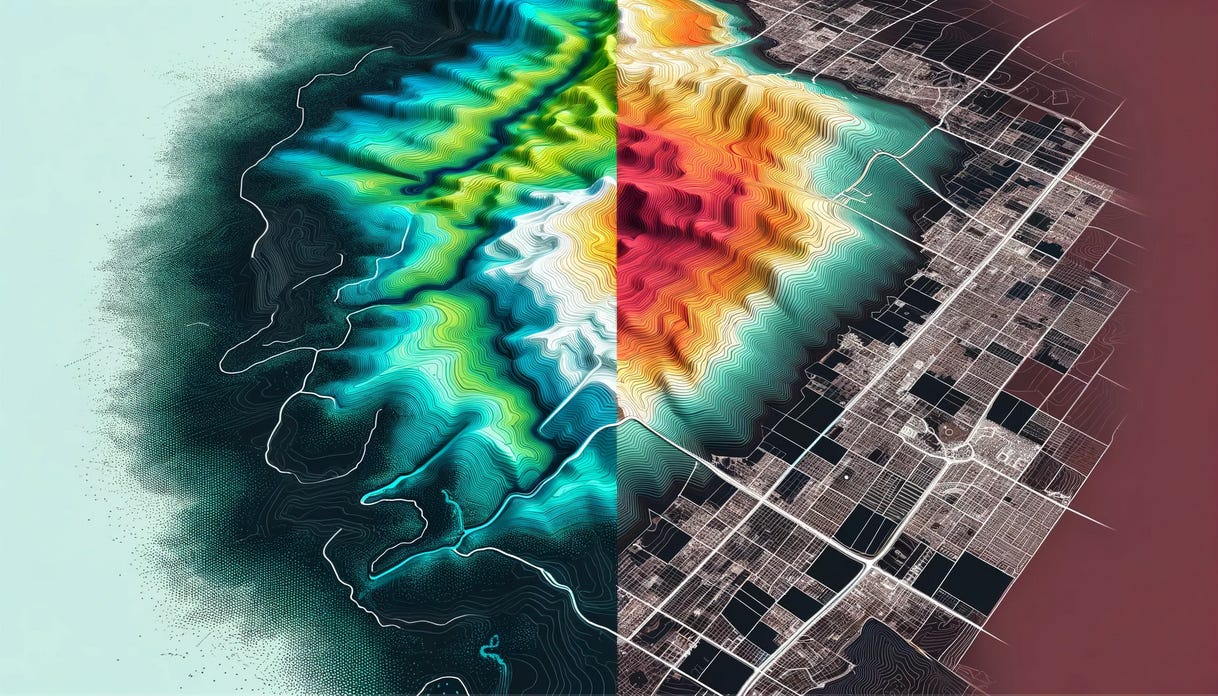
An advantage to using raster data is that their coverage is continuous. So, if we need to visualize a dynamically changing event or map continuous data like temperature, elevation, weather, or elevation, we'd use raster data.
 of a North American landscape, showcasing varied terrain features such as mountains, valleys, and rivers. The image should highlight the contours and topographic relief to emphasize the elevation changes across the landscape. Natural colors should be used to depict different elevations, with higher areas in cooler tones like blues and greens, and lower areas in warmer tones such as browns and yellows. The visual representation should aim to convey the complexity and beauty of the terrain in a realistic manner, allowing for a clear understanding of the geographical features and elevation differences.")
Take, for instance, mapping terrain elevation across a vast expanse of land. Utilizing raster data, we can construct high-resolution elevation models that capture the landscape's undulating contours. We can then use the digital elevation model (DEM) to assess flood risk zones, identify suitable locations for infrastructure development, or simulate natural processes like erosion and sedimentation.
Another advantage of raster data is the ability to use interpolation when the data we've collected is sparse or unevenly distributed. This technique is beneficial when data collection is costly, time-consuming, or impractical.
There are several types of interpolation (I'll write another post that goes into more detail).
Spatial interpolation: we're estimating values at unsampled locations within the spatial extent of the dataset.
Temporal interpolation: We estimate values at intermedia time points based on observations at discrete time intervals. This technique is usually used in time series analysis and forecasting.
Using rasters does come with its disadvantages. For starters, the volume of raster datasets can be challenging regarding storage, processing, and transmission, particularly when dealing with high-resolution imagery.
Another disadvantage is pixelation. This is noticeable when zooming in on images or maps. Individual pixels become more prominent as we zoom in, leading to a loss of detail and a blocky appearance. Since rasters have a fixed resolution, there's a limit to the level of detail that can be displayed. When we zoom in beyond the original resolution of the raster image, the software interpolates the existing pixels to fill in the gaps, which can result in a loss of clarity and sharpness.
To mitigate pixelation, we could stick to using higher-resolution raster data where available. But, as mentioned before, using high-resolution rasters comes with trade-offs in file size, processing, and storage.
Vector Data
Vector data are made up of points, lines, and polygons. Rasters capture continuous data, while vectors represent discrete data.
Points represent individual locations on the Earth's surface. Each point is defined by its coordinates, typically as latitude and longitude. Points are used to mark specific landmarks or points of interest.
Lines are one-dimensional and are used to show boundaries or other linear features like roads, rivers, railways, etc. You can think of lines as a series of connected points.
Polygons are two-dimensional and represent an area. They are like a series of lines that make a closed shape. This shape can be as simple as a rectangle or as complex as a land parcel or ecological habitat. Polygons serve as the cornerstone of spatial analysis, facilitating tasks such as area calculation, spatial aggregation, and overlay operations.
Each vector feature can also have different attributes associated with it. Attributes can be of various types, like numeric or text. They can include various information, such as names, classifications, quantitative data, or other descriptive data related to the vector feature.
For example, in a GIS project focusing on urban planning, points could represent locations of interest (such as schools, hospitals, or parks), lines could represent streets or utilities, and polygons could represent zoning areas or land use types. Each of these vector features could have attributes attached to them, like the name of a school, the type of street, or the category of land use.
Points, lines, and polygons are the building blocks of vector data; however, depending on your GIS software, there can be support for different geometry types.
We can also use vector data for relational analysis to examine spatial relationships, connectivity, and proximity between different entities.
Vector data does not pixelate or lose sharpness when zooming in. Vector data can also be edited, allowing features to be reshaped or adjusted as necessary. This contrasts with the fixed layout of raster data.
Vector data also has some limitations. For example, complex geometries or highly irregular shapes may pose challenges for data storage, processing, or rendering.
Even though raster and vector data have different strengths and weaknesses, they work together in GIS to discover new aspects of spatial analysis. By using the unique abilities of both types of data, GIS experts can make informed decisions and explore new territories.